Are you curious about the common indicators used by crypto trading bots? Look no further! In this article, we will explore the revolutionary X-Shot Sniper BOT, developed by $X Project, which is set to redefine the way traders engage with the cryptocurrency market. With lightning-fast execution, customizable trading strategies, and the ability to replicate trades from selected wallets, X-Shot offers unmatched speed, precision, and opportunities for passive income. Not only that, but X-Shot also introduces exclusive premium features and contributes towards the growth of the X-Token ecosystem. So, let’s dive in and discover what indicators these cutting-edge crypto trading bots utilize for optimal results.

Moving Averages
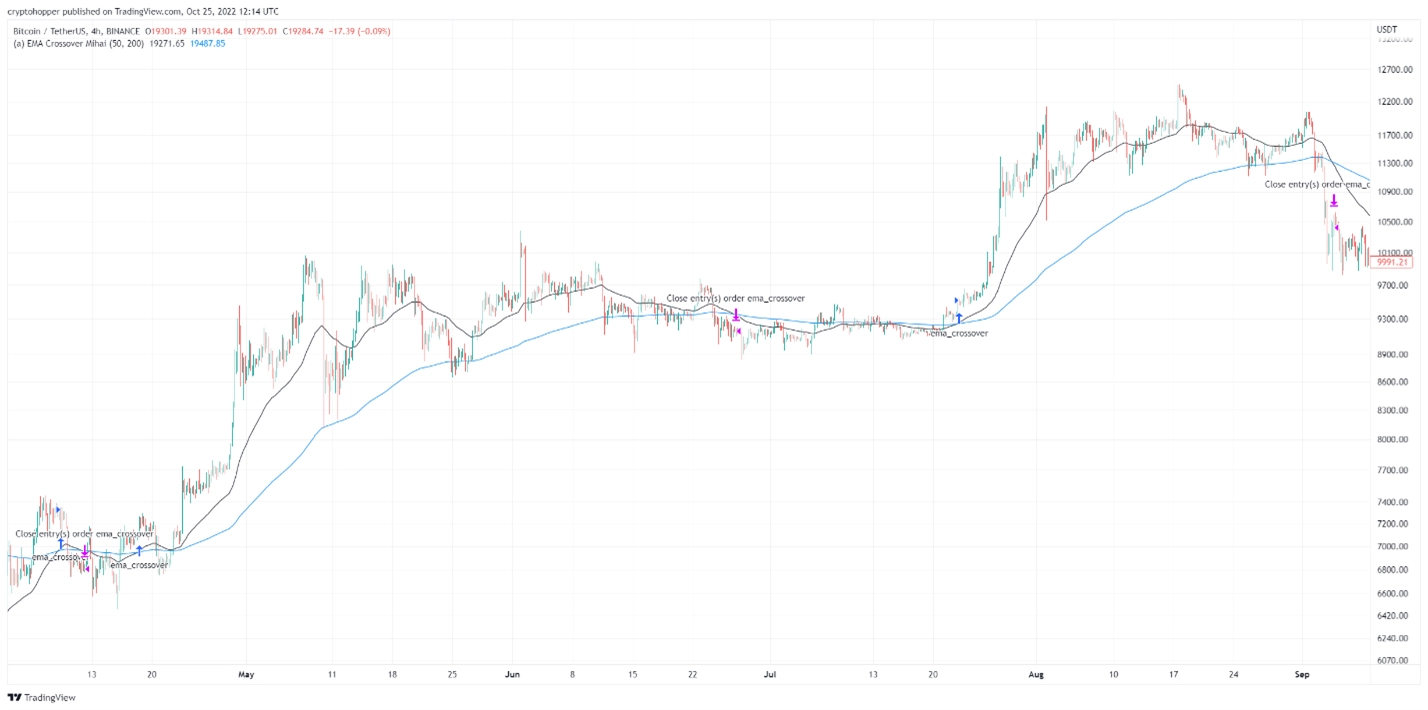
Moving averages are popular technical indicators used by crypto trading bots to analyze price trends and identify potential buying or selling opportunities. There are three main types of moving averages: Simple Moving Average (SMA), Exponential Moving Average (EMA), and Weighted Moving Average (WMA).
Simple Moving Average (SMA)
The Simple Moving Average (SMA) calculates the average price of an asset over a specified period. It smooths out price fluctuations and provides a clearer picture of the overall trend. Traders often use SMAs to identify support and resistance levels or to determine when an asset is experiencing a trend reversal.
Exponential Moving Average (EMA)
The Exponential Moving Average (EMA) is similar to the SMA but gives more weight to recent price data. This makes the EMA more responsive to price changes and can help traders identify trends more quickly. Traders commonly use EMAs to generate buy or sell signals when the shorter-term EMA crosses above or below the longer-term EMA.
Weighted Moving Average (WMA)
The Weighted Moving Average (WMA) assigns different weights to each data point within the chosen period. This means that more recent prices have a greater impact on the average than older prices. WMAs provide a balance between SMAs and EMAs, giving significance to both recent and historical price data.
Relative Strength Index (RSI)
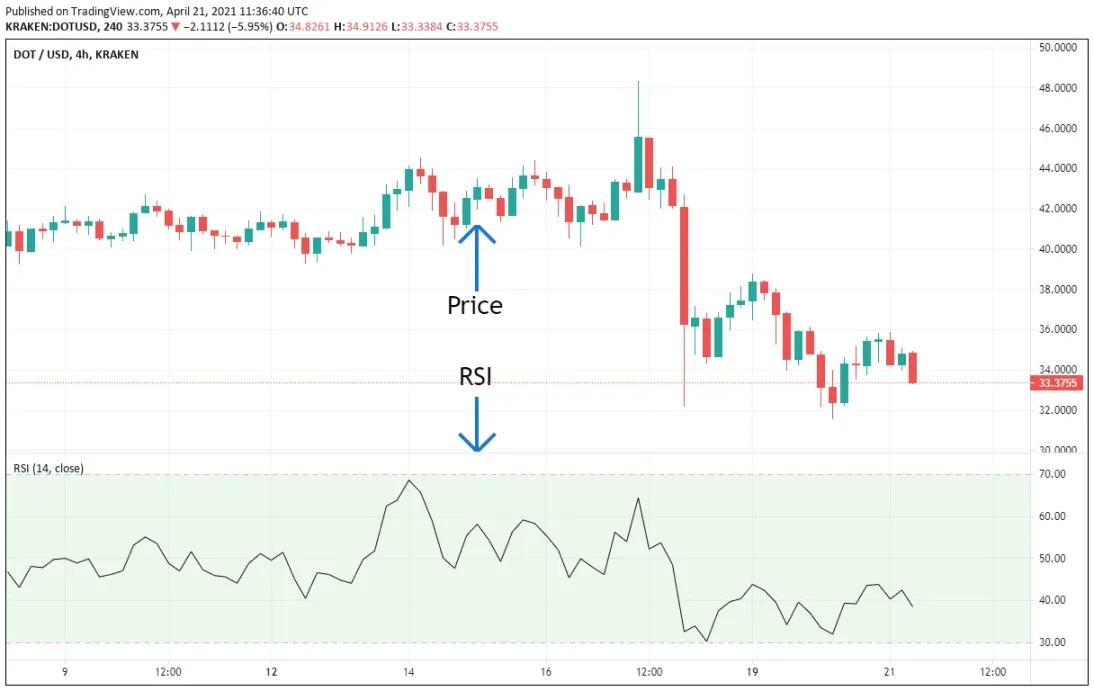
The Relative Strength Index (RSI) is a momentum oscillator that measures the speed and change of price movements. It oscillates between 0 and 100 and is often used to determine whether an asset is overbought or oversold.
Overbought and Oversold Levels
RSI values above 70 are considered overbought, indicating that the asset may be due for a price correction or reversal. On the other hand, RSI values below 30 are considered oversold, suggesting that the asset may be undervalued and due for a potential price increase.
Divergence Signals
Divergence occurs when the price of an asset and the RSI indicator move in opposite directions. Bullish divergence is when the price makes a lower low, but the RSI makes a higher low, indicating a potential trend reversal to the upside. Conversely, bearish divergence is when the price makes a higher high, but the RSI makes a lower high, suggesting a potential trend reversal to the downside.
MACD (Moving Average Convergence Divergence)
The Moving Average Convergence Divergence (MACD) is a popular trend-following momentum indicator. It consists of three components: the MACD line, the signal line, and the histogram.
MACD Line
The MACD line is calculated by subtracting the longer-term EMA from the shorter-term EMA. It represents the difference between the two EMAs and provides insights into the strength and direction of the trend. Traders typically look for the MACD line to cross above or below the signal line as potential buy or sell signals.
Signal Line
The signal line is a smoothed average of the MACD line and is often a 9-day EMA. It helps confirm potential trend reversals or trend continuations indicated by the MACD line crossover.
Histogram
The histogram represents the difference between the MACD line and the signal line. It provides a visual representation of the convergence or divergence of the two lines. Positive histogram bars indicate bullish momentum, while negative bars indicate bearish momentum.
Bollinger Bands
Bollinger Bands are volatility indicators that consist of three lines: the upper band, the lower band, and the middle band.
Upper Band
The upper band is calculated by adding a specified number of standard deviations to the middle band. It represents the upper boundary of price volatility and can be used as a resistance level.
Lower Band
The lower band is calculated by subtracting a specified number of standard deviations from the middle band. It represents the lower boundary of price volatility and can act as a support level.
Middle Band
The middle band is usually a simple moving average, typically of 20 periods. It represents the average price of the asset and can act as a reference point for identifying the overall trend.

Volume Weighted Average Price (VWAP)
The Volume Weighted Average Price (VWAP) is a technical indicator that takes into account both the price and volume of trades. It calculates the average price weighted by the trading volume during a specific period.
Intraday VWAP
Intraday VWAP is calculated over a single trading day and helps identify the average price at which traders have transacted during that day. It can be used to gauge the overall sentiment of traders and determine whether an asset is being accumulated or distributed.
Long-Term VWAP
Long-term VWAP is calculated over an extended period, such as several weeks or months. It provides a broader perspective on the average price paid by traders over time and can help identify major support or resistance levels.
Stochastic Oscillator
The Stochastic Oscillator is a momentum indicator that compares the closing price of an asset to its price range over a specified period. It oscillates between 0 and 100 and is used to identify overbought and oversold levels.
%K Line
The %K line represents the current closing price relative to the high and low price range over a chosen period. It is more sensitive to price fluctuations and can provide early indications of potential trend reversals.
%D Line
The %D line is a smoothed average of the %K line and is often a 3-day simple moving average. It helps smooth out fluctuations in the %K line and provides a clearer signal of overbought or oversold conditions.
Overbought and Oversold Levels
Similar to the RSI, the Stochastic Oscillator uses overbought and oversold levels to identify potential trading opportunities. When the %K line crosses above the %D line and reaches above 80, it suggests that the asset may be overbought. Conversely, when the %K line crosses below the %D line and falls below 20, it indicates that the asset may be oversold.

Fibonacci Retracement
Fibonacci Retracement is a technical analysis tool based on the Fibonacci sequence. It is used to identify potential support and resistance levels based on the ratio between numbers in the Fibonacci sequence.
Retracement Levels
The main retracement levels include 23.6%, 38.2%, 50%, 61.8%, and 78.6%. These levels are drawn from the high to low or low to high of a price movement and can act as potential areas of support or resistance.
Extension Levels
Extension levels are additional levels beyond the typical retracement levels. Traders use extension levels to identify potential price targets when an asset is experiencing a strong trend. Common extension levels include 127.2%, 161.8%, and 261.8% of the price movement.
Ichimoku Cloud
The Ichimoku Cloud is a comprehensive technical analysis tool that provides insights into support and resistance levels, trend direction, and momentum.
Tenkan-Sen
The Tenkan-Sen is a fast-moving average that measures the average price over a specified period. It helps identify short-term trend direction and potential support or resistance levels.
Kijun-Sen
The Kijun-Sen is a slower-moving average that measures the average price over a longer period. It provides a broader perspective on the trend direction and can act as a stronger support or resistance level.
Senkou Span A and B
Senkou Span A and B create the boundaries of the Ichimoku Cloud. Senkou Span A is calculated by averaging the Tenkan-Sen and the Kijun-Sen and is plotted a specified number of periods ahead. Senkou Span B is calculated by averaging the highs and lows over a longer period and is also plotted a specified number of periods ahead.
Chikou Span
The Chikou Span represents the closing price plotted a specified number of periods back. It provides insights into potential trend reversals or continuations based on the relationship between the current price and historical price levels.

Average True Range (ATR)
The Average True Range (ATR) is a volatility indicator that measures the average range between the highest and lowest price of an asset over a specified period.
Volatility Measurement
The ATR helps traders gauge the volatility of an asset and can assist with setting appropriate stop loss levels and determining position sizing. Higher ATR values indicate greater volatility, while lower ATR values suggest lower volatility.
Stop Loss Placement
Traders often use the ATR to set stop loss levels based on the current price volatility. By determining the average price range, traders can set stop loss orders at a certain multiple of the ATR to protect against excessive losses.
On-Balance Volume (OBV)
On-Balance Volume (OBV) is a volume-based indicator that measures buying and selling pressure to predict price movements.
Accumulation and Distribution
OBV adds volume on up days and subtracts volume on down days. The cumulative value of OBV provides insights into whether buying or selling pressure is dominating the market. If OBV is rising, it suggests buying pressure, while a declining OBV indicates selling pressure.
Confirmation of Price Trends
When the OBV confirms the direction of the price trend, it can provide confirmation of a strong trend. For example, if the price is making higher highs while OBV is also making higher highs, it suggests a healthy uptrend. Conversely, if the price is making lower lows while OBV is also making lower lows, it indicates a strong downtrend.

